
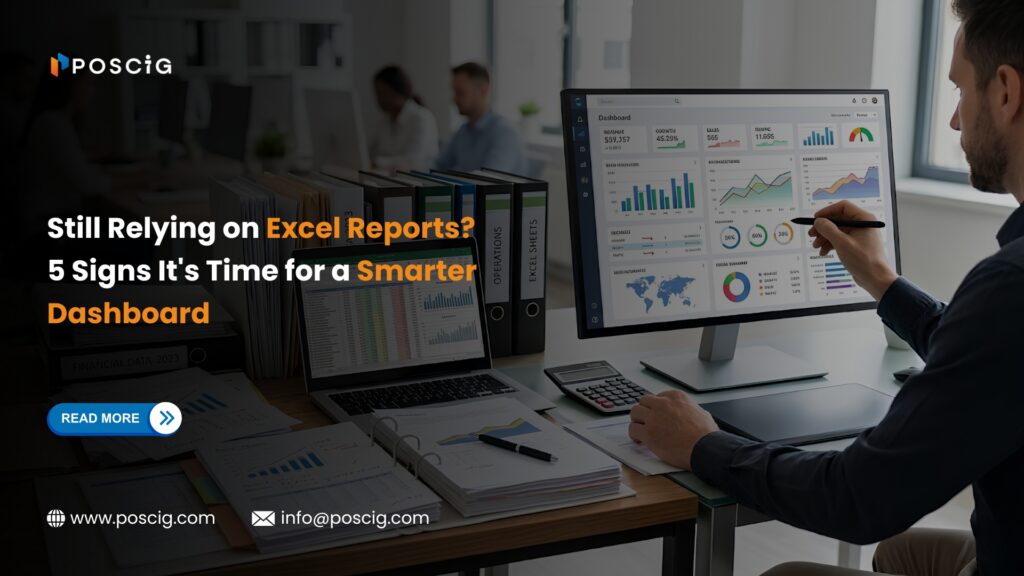
Excel has been the go-to reporting tool for businesses for decades. It’s familiar, flexible, and easy to use. But as your business grows, so does the complexity of your data.
What once worked for tracking sales, expenses, and performance metrics can quickly become a bottleneck. Teams spend hours creating reports, leaders make decisions based on outdated information, and critical business insights remain hidden in spreadsheets.
In today’s competitive environment, businesses need real-time visibility into their operations not reports that are already outdated by the time they reach management.
If your organization still depends heavily on Excel reports, here are five signs that it’s time to upgrade to a smarter dashboard solution.
1. Reporting Takes Too Much Time
Does your team spend hours every week collecting data, updating spreadsheets, and preparing reports?
Manual reporting is not only time-consuming but also diverts valuable resources away from strategic tasks. Every hour spent creating reports is an hour not spent growing your business.
A modern dashboard automatically collects and visualizes data, allowing teams to focus on analysis and decision-making rather than report preparation.
2. Your Data Is Always Outdated
By the time monthly or weekly reports are prepared, the numbers may no longer reflect the current state of your business.
This delay can impact:
- Sales decisions
- Marketing performance tracking
- Operational planning
- Resource allocation
Real-time dashboards provide instant access to current business data, helping leaders respond quickly to opportunities and challenges.
3. Different Teams Have Different Numbers
Have you ever attended a meeting where sales, finance, and operations presented conflicting figures?
This often happens when teams maintain separate spreadsheets and reporting methods.
A centralized dashboard creates a single source of truth by consolidating data from multiple systems into one easy-to-understand view.
The result? Better collaboration, fewer errors, and more confidence in decision-making.
4. Important Trends Are Difficult to Spot
Spreadsheets are great for storing data but not always effective for uncovering patterns.
Business leaders need answers to questions like:
- Which products are driving revenue growth?
- Which marketing campaigns generate the best ROI?
- Where are operational bottlenecks occurring?
- What customer trends are emerging?
Interactive dashboards turn raw data into visual insights, making trends and opportunities easier to identify.
5. Your Business Has Outgrown Excel
As businesses scale, data becomes more complex.
More customers.
More transactions.
More departments.
More systems.
Eventually, spreadsheets become difficult to manage, prone to errors, and unable to deliver the level of visibility growing businesses require.
A scalable dashboard solution grows with your organization and ensures decision-makers always have access to accurate, actionable insights.
Why Businesses Are Moving Beyond Excel
Businesses today need more than static reports.
They need:
✅ Real-time visibility
✅ Automated reporting
✅ KPI tracking
✅ Data-driven decision making
✅ Improved productivity
✅ Better forecasting
Modern dashboards provide all of these capabilities while eliminating many of the limitations associated with manual spreadsheet reporting.
What Is a Business Dashboard?
A business dashboard is a visual reporting platform that gathers data from multiple sources and displays key metrics in real time.
Instead of manually reviewing spreadsheets, users can instantly monitor performance, identify trends, and make informed decisions through intuitive charts, graphs, and KPIs.
How Poscig Technologies Helps Businesses Unlock Better Insights
At Poscig Technologies, we help organizations transform data into meaningful business intelligence.
Our custom dashboard and analytics solutions enable businesses to:
- Automate reporting processes
- Track key performance indicators
- Consolidate data from multiple systems
- Improve operational visibility
- Make faster and smarter decisions
Whether you’re a growing company looking to improve reporting or an enterprise seeking advanced analytics capabilities, our team can help you build dashboards tailored to your business goals.
FAQs
Businesses are replacing Excel with dashboards because dashboards provide real-time insights, automated reporting, and better visibility into business performance, helping organizations make faster and more informed decisions.
Business dashboards improve reporting efficiency, centralize data, track KPIs, identify trends, and support data-driven decision-making.
Excel remains useful for basic reporting and analysis. However, businesses dealing with large volumes of data often benefit from dashboard solutions that provide automation and real-time visibility.
Yes, Modern dashboards can connect with CRM systems, ERP platforms, accounting software, marketing tools, databases, and many other business applications.

Ready to Move Beyond Spreadsheets?
If reporting is slowing down your business or preventing your team from making timely decisions, it may be time to explore a smarter approach.
Poscig Technologies helps businesses turn complex data into clear, actionable insights through custom Business Intelligence and Dashboard Solutions.
👉 Schedule a Free Dashboard Consultation