
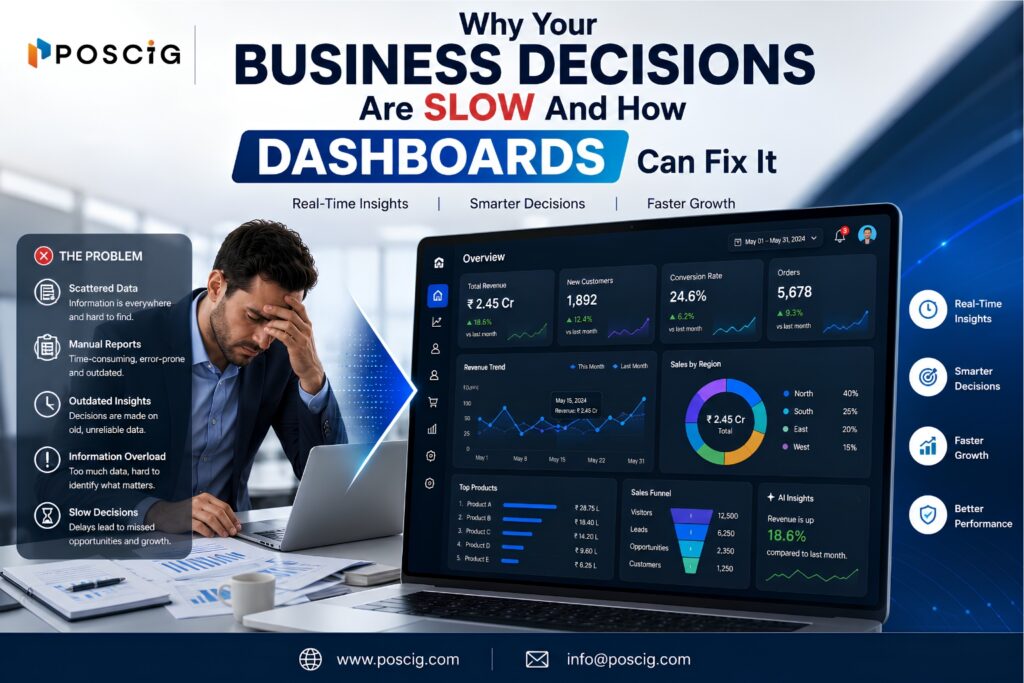
In today’s fast-paced business environment, making quick and informed decisions is no longer optional it’s a necessity. Yet many organizations still rely on spreadsheets, manual reports, and disconnected data sources to guide critical business decisions. The result? Delayed responses, missed opportunities, and reduced competitiveness.
If your team spends hours gathering data before making decisions, it may be time to rethink your approach. Modern business dashboards provide real-time visibility into key metrics, helping organizations move faster and make smarter decisions.
In this blog, we’ll explore why business decisions often become slow and how dashboard solutions can transform the way organizations operate.
What Causes Slow Business Decision-Making?
Many businesses assume slow decisions are caused by a lack of information. In reality, the problem is often the opposite too much scattered information and no centralized view.
1. Data Is Stored Across Multiple Systems
Most businesses use various platforms for sales, finance, marketing, customer support, and operations. When data is spread across different tools, teams spend valuable time collecting and consolidating information before making decisions.
Without a unified view, decision-makers struggle to see the complete picture.
2. Dependence on Manual Reporting
Many organizations still rely on manually generated reports. Employees export data into spreadsheets, clean it, create charts, and distribute reports to stakeholders.
This process is:
- Time-consuming
- Prone to human error
- Often outdated by the time reports are shared
3. Lack of Real-Time Insights
Business environments change quickly. Customer behavior, sales trends, operational performance, and market conditions can shift within hours.
When leaders rely on weekly or monthly reports, they make decisions based on old information instead of current realities.
4. Information Overload
Businesses collect enormous amounts of data, but having more data does not automatically lead to better decisions.
Without visualization and context, teams struggle to identify:
- Trends
- Bottlenecks
- Risks
- Growth opportunities
5. Poor Cross-Department Visibility
Sales, marketing, finance, and operations often work with separate reports and KPIs.
This creates:
- Misalignment between departments
- Conflicting priorities
- Delayed decision-making
A lack of shared visibility slows organizational progress.
What Is a Business Dashboard?
A business dashboard is a centralized visual platform that gathers data from multiple sources and presents it through charts, graphs, KPIs, and performance metrics.
Instead of reviewing dozens of spreadsheets, decision-makers can access critical insights from a single interface.
Business dashboards can display:
- Revenue performance
- Sales pipelines
- Marketing ROI
- Customer acquisition metrics
- Financial KPIs
- Inventory levels
- Operational performance
- Employee productivity
The goal is simple: provide actionable insights in real time.
How Dashboards Help Businesses Make Faster Decisions
Real-Time Data Access
Modern dashboards automatically update data from connected systems.
Decision-makers can:
- Monitor business performance instantly
- Identify emerging trends
- Respond quickly to changing conditions
This eliminates the delays associated with manual reporting.
Centralized Business Intelligence
Dashboards consolidate information from:
- CRM systems
- ERP platforms
- Accounting software
- Marketing tools
- Customer support platforms
Having all relevant information in one place significantly reduces analysis time.
Faster Problem Identification
Visual dashboards make it easier to identify:
- Sales declines
- Revenue gaps
- Customer churn
- Operational bottlenecks
- Marketing inefficiencies
Teams can detect problems before they become costly.
Improved Collaboration
When everyone works from the same data source:
- Teams align faster
- Meetings become more productive
- Decision-making becomes more objective
A shared dashboard eliminates confusion caused by conflicting reports.
Better Forecasting
Advanced dashboards help businesses predict future outcomes using historical and real-time data.
This enables leaders to:
- Plan resources effectively
- Anticipate demand
- Manage risks proactively
Key Features of an Effective Business Dashboard
Not all dashboards deliver the same value. An effective dashboard should include:
Custom KPI Tracking
Every business has unique goals.
Dashboards should allow organizations to track metrics that matter most, such as:
- Revenue growth
- Customer retention
- Lead conversion rates
- Project completion rates
Interactive Visualizations
Interactive charts and graphs allow users to explore data and uncover deeper insights.
Automated Data Integration
A modern dashboard should automatically pull data from multiple systems without manual intervention.
Mobile Accessibility
Decision-makers often need access to business insights while traveling or working remotely.
Mobile-friendly dashboards provide flexibility and convenience.
Real-Time Alerts
Dashboards can notify teams when key metrics exceed or fall below predefined thresholds.
This enables immediate action.
Industries That Benefit Most From Business Dashboards
Virtually every industry can benefit from dashboard solutions, including:
Retail
Track sales performance, inventory levels, and customer behavior.
Healthcare
Monitor operational efficiency, patient metrics, and resource utilization.
Manufacturing
Improve production visibility and identify process inefficiencies.
Finance
Track revenue, expenses, profitability, and forecasting metrics.
Logistics
Monitor deliveries, fleet performance, and supply chain operations.
Technology Companies
Measure application performance, customer engagement, and project progress.
Why Business Intelligence Matters More Than Ever
The modern business landscape generates enormous volumes of data every day.
Companies that successfully transform data into actionable insights gain significant advantages:
- Faster decisions
- Better customer experiences
- Improved profitability
- Stronger operational performance
Organizations that continue relying on spreadsheets and manual reporting risk falling behind competitors that leverage modern business intelligence solutions.
FAQs
A business dashboard provides real-time visibility into critical metrics, enabling faster and more informed decision-making.
Dashboards help organizations identify trends, track KPIs, reduce reporting time, and improve collaboration across teams.
Yes. Modern dashboard solutions can integrate with CRM systems, ERP platforms, accounting software, marketing tools, and other business applications.
Absolutely. Small businesses can use dashboards to monitor performance, track growth, and make data-driven decisions without requiring large analytics teams.
Reports provide historical information, while dashboards offer real-time, interactive insights that support ongoing decision-making.

Make Faster, Smarter Decisions with Poscig Technologies
Slow decision-making often stems from fragmented data, manual reporting processes, and limited visibility into business performance. Modern dashboard solutions eliminate these challenges by providing real-time insights, centralized data access, and actionable business intelligence.
At Poscig Technologies, we help businesses transform raw data into meaningful insights through advanced Business Intelligence & Analytics Solutions Our custom dashboards empower organizations to monitor performance, improve operational efficiency, and make confident decisions faster.
Ready to unlock the power of real-time business intelligence? Contact Poscig Technologies today and discover how custom dashboards can accelerate your business growth.