

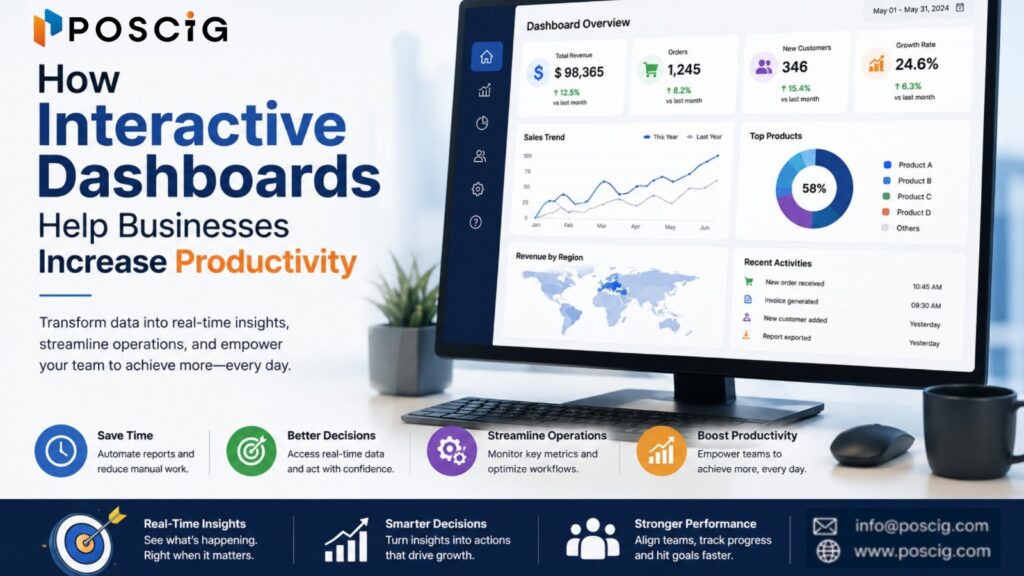
Businesses generate vast amounts of data every day, but raw data alone doesn’t drive growth. The ability to transform data into meaningful insights is what helps organizations make faster decisions, improve operational efficiency, and stay ahead of the competition.
Interactive dashboards provide a centralized, real-time view of key business metrics, enabling decision-makers to monitor performance, identify trends, and act quickly. Instead of relying on manual spreadsheets and static reports, businesses can access dynamic visual dashboards that simplify complex data and improve productivity.
In this blog, we’ll explore how interactive dashboards enhance business productivity and why investing in Business Intelligence (BI) solutions is essential for sustainable growth.
What Are Interactive Dashboards?
Interactive dashboards are visual reporting tools that consolidate data from multiple sources into a single, user-friendly interface. They allow users to filter, drill down, and analyze real-time information without requiring technical expertise.
These dashboards help businesses monitor KPIs, track performance, and make data-driven decisions faster.
Why Are Interactive Dashboards Important?
Traditional reports often become outdated before they are reviewed. Interactive dashboards provide real-time visibility, helping organizations respond to changing business conditions immediately.
Key Benefits:
- Access real-time business insights
- Reduce manual reporting efforts
- Improve team collaboration
- Identify trends and opportunities quickly
- Support faster and more accurate decision-making
How Interactive Dashboards Increase Business Productivity
1. Faster Decision-Making
Interactive dashboards display real-time KPIs, enabling managers to identify issues and opportunities without waiting for manual reports.
Business Impact
- Faster responses to business challenges
- Improved operational efficiency
- Better strategic planning
2. Eliminate Manual Reporting
Automated dashboards collect and visualize data from multiple systems, significantly reducing time spent creating spreadsheets and reports.
Benefits
- Saves employee time
- Reduces human errors
- Improves reporting accuracy
3. Real-Time Performance Monitoring
Business leaders can monitor sales, revenue, inventory, customer satisfaction, and operational performance from one centralized dashboard.
This enables proactive decision-making before issues escalate.
4. Better Team Collaboration
When every department accesses the same live data, communication becomes more transparent and decisions are aligned across teams.
Interactive dashboards create a single source of truth for the organization.
5. Improved KPI Tracking
Dashboards make it easy to track important business metrics, such as:
- Revenue growth
- Sales performance
- Customer acquisition
- Operational efficiency
- Marketing ROI
- Inventory levels
Monitoring KPIs in real time helps businesses stay focused on strategic goals.
6. AI-Powered Business Insights
Modern dashboards integrate Artificial Intelligence to identify patterns, predict trends, and generate actionable recommendations.
AI-powered analytics enable businesses to make smarter, proactive decisions rather than reacting to historical data.
Industries That Benefit from Interactive Dashboards
Interactive dashboards add value across multiple industries, including:
- Manufacturing
- Retail & E-commerce
- Healthcare
- Logistics & Supply Chain
- Financial Services
- Education
- IT & Technology
- Real Estate
Why Choose Poscig Technologies?
At Poscig Technologies, we design custom Business Intelligence and Analytics solutions that help organizations transform data into actionable insights.
Our BI services include:
- Interactive Business Dashboards
- AI-Powered Analytics
- Executive Reporting Dashboards
- KPI Monitoring Solutions
- Data Visualization
- Real-Time Reporting
- Predictive Analytics
- Custom BI Consulting
Our experts help businesses build scalable dashboard solutions that improve productivity, streamline operations, and support informed decision-making.
FAQs
What is an interactive dashboard?
An interactive dashboard is a visual tool that displays real-time business data, allowing users to filter, analyze, and monitor key performance indicators (KPIs).
How do interactive dashboards improve productivity?
They automate reporting, reduce manual work, provide real-time insights, and enable faster decision-making across departments.
Which industries benefit from interactive dashboards?
Industries such as manufacturing, healthcare, retail, finance, logistics, IT, and education benefit from dashboard-driven analytics.
What data can be displayed on a dashboard?
Dashboards can display sales, revenue, finance, inventory, customer analytics, operational KPIs, marketing performance, and more.
Why should businesses invest in Business Intelligence dashboards?
Business Intelligence dashboards improve visibility, reduce reporting time, enhance collaboration, and help organizations make informed, data-driven decisions.
Conclusion
Interactive dashboards are no longer just reporting tools they are strategic assets that help businesses improve productivity, streamline operations, and make faster, data-driven decisions. Organizations that leverage real-time analytics gain better visibility into their performance, reduce manual effort, and respond more effectively to changing business needs.
Whether you’re managing sales, operations, finance, or customer performance, interactive dashboards empower your teams with the insights needed to drive continuous growth.



Ready to Improve Business Productivity with Interactive Dashboards?
If your business still relies on manual reports and spreadsheets, it’s time to modernize your reporting process.
Poscig Technologies provides customized Business Intelligence and Analytics solutions designed to deliver real-time insights, automate reporting, and improve operational efficiency.
📞 Contact Poscig Technologies today to schedule a free consultation and discover how interactive dashboards can help your business make smarter decisions and achieve measurable growth.